Choose a source for your rainfall lookup
| What you need | Where to start | What to check |
|---|---|---|
| A free daily precipitation record from a weather station | NOAA Past Weather | Station location, available dates, units, and observation period. |
| Another nearby rain gauge for comparison | CoCoRaHS precipitation reports | The observer's station, measurement time, and whether the total covers one day or several. |
| Available weather for an address and date, with an optional organized PDF | StormRecord's free preview | The location-based precipitation total, source coverage, and the records available before paying. |
Free source records may be all you need. An organized report is useful when you want to keep weather information together or share it with someone reviewing an incident.
How to find rainfall for a past date with NOAA
The NOAA Past Weather tool displays historical station data. To look up precipitation:
- Search the location. Enter an address, city, or ZIP code to find nearby stations.
- Choose a station. Check its location and whether it has records for your date.
- Set the date and select precipitation. Read the amount with its units and any data notes.
- Check the reporting period. Confirm what time span the daily value covers before comparing it with another source.
- Save the record. Keep the station identifier, date, units, and source with your download.
NOAA's tool instructions explain the date controls and available downloads. Climate Data Online is another route for finding station records by date and location.
A daily total cannot tell you exactly when rain fell. If timing matters, look for hourly records rather than treating a daily summary as an hourly timeline.
How to check rainfall with StormRecord
Use the existing weather report search when you want to check an incident date and decide whether you need a document to keep.
- Choose your U.S. address. Select the matching address suggestion and confirm the location.
- Select the local date. Choose a date from yesterday through the past three years.
- Review the free preview. Check total precipitation and the displayed source coverage. Temperature, wind, warnings, and regional storm records may provide additional context where available.
- Download a report if useful. The optional $9.99 PDF includes the available summary, hourly records, charts, and supporting weather records for that address and date.
StormRecord compiles Visual Crossing weather values and available regional records. It is an independent service. See how StormRecord sources and presents its data.
Understand the rainfall total before using it
A daily total and an hourly amount answer different questions
A daily total answers how much precipitation the source reports over the day. An hourly amount helps you examine a smaller part of that day.
For example, a fictional daily total of 2 inches could include a short downpour or rain spread across many hours. The daily number alone cannot distinguish those patterns. It also cannot tell you how much rain fell during a particular five-minute period.
If your incident happened around midnight, check whether the relevant weather spans two dates. Each StormRecord purchase covers one local calendar date.
A calendar day may differ from a 24-hour gauge report
Two reports labeled with the same date may cover different hours. For example, a gauge total ending at 7 a.m. can include rain from the previous afternoon. It is not automatically the total for midnight to midnight on the date shown.
CoCoRaHS encourages consistent daily observation times, commonly 7 a.m. Check the actual observation time and interval before comparing totals. CoCoRaHS observation guidance
Precipitation does not always mean rain alone
Precipitation can include the liquid equivalent of snow and other frozen precipitation. It is different from snowfall depth. Visual Crossing defines its precipitation field this way, so keep the field's label when recording the amount. Visual Crossing field definitions
A missing value is different from zero
An unavailable value means the record does not provide an amount. Do not fill that gap with zero. A displayed zero also needs context: some sources round values or handle traces separately. Visual Crossing notes that trace precipitation can appear as zero in its precipitation amount field. Visual Crossing precipitation documentation
Nearby sources can report different amounts
Rainfall can vary across a neighborhood. A station observation, a radar estimate, and a provider's location-based compilation also use different methods. The National Weather Service explains limitations in radar rainfall estimates.
Before comparing two totals, check their locations, time periods, units, and source types. Keep each value with its source rather than substituting a nearby higher number for the property you are documenting.
Example: rainfall in Tampa on October 9, 2024
StormRecord's published Tampa example illustrates how to preserve the context around a precipitation total.
| Part of the record | Published example |
|---|---|
| Selected location | Tampa City Hall, 315 E Kennedy Blvd, Tampa, Florida |
| Selected date | October 9, 2024 |
| Daily precipitation shown | 11.99 inches |
| Weather-value source | Visual Crossing location-based compilation |
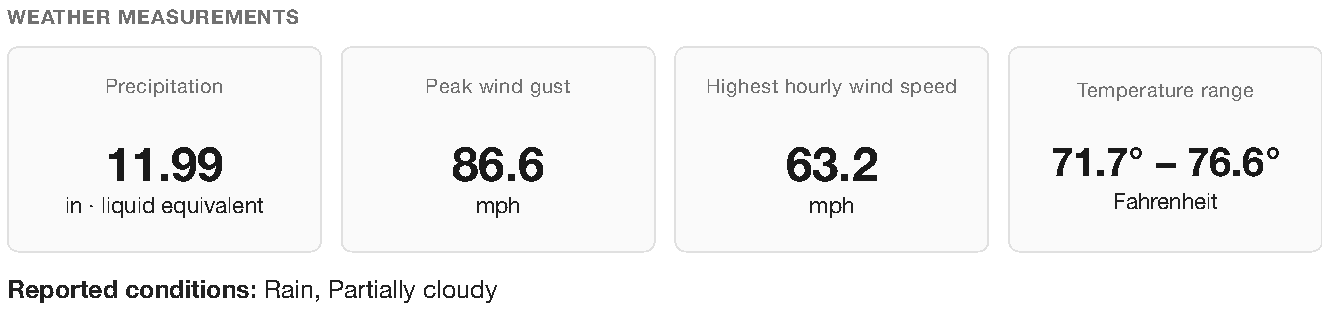
The useful record is the amount together with the date, location, and source. 11.99 inches is the daily precipitation value shown in this StormRecord example. It should not be described as a rain gauge measurement taken at City Hall, an hourly amount, or a measurement of water inside a building.
The hourly records can help you examine timing where values are available. The daily total alone does not identify the cause of any property damage.
Source: StormRecord's approved Tampa sample PDF, page 1. For more on the report's sections, see how to read a historical weather report.
Keep rainfall records with your incident documentation
If you are collecting records for water damage, an interrupted workday, or another incident, keep these details together:
- Location: The property address and the location or geographic scope of the weather data.
- Date and time: When the incident was observed, including the time zone if known.
- Amount and interval: The precipitation value, units, and hours or day it covers.
- Source: The provider or station, download date, and any missing-data notes.
- Property or work records: Photographs, inspection findings, receipts, or site logs relevant to the incident.
Ask the recipient what format they need before buying a report. Weather records can provide context, but rainfall alone does not establish why water entered a building, whether insurance covers the damage, or whether a contract allows extra time.
For related checklists, see weather reports for insurance claims and the free construction weather delay log.
Questions about historical rainfall totals
Can I find rainfall totals by ZIP code?
Yes. A ZIP code can help locate nearby station records in NOAA tools. Check the station location before treating its value as representative of the whole ZIP code. StormRecord's search uses a selected U.S. address.
Can I check how much it rained yesterday?
StormRecord accepts searches for yesterday. Check the returned precipitation and source coverage before relying on a value. Availability varies, and recent records can be updated as sources publish or correct information.
Does a daily rainfall total tell me how hard it rained?
It tells you the amount over that reporting period. To examine how rain was distributed through the day, look for hourly or finer records. Do not assume that dividing a daily total by 24 describes the intensity during the storm.
Can a rainfall report support an insurance claim?
It can be included with the other records you provide. Ask your insurer which sources and document formats are needed. StormRecord's PDF is an automated compilation, not a certified government record, property inspection, or expert determination of coverage or causation.