THE REPORT, EXPLAINED
How to read a historical weather report
A winter storm in Boston. Tornado warnings in Bloomington. A hurricane in Tampa. Three examples show how to turn a PDF full of numbers into a clearer picture of the day.
Keep each value with its time, units, and source. A daily maximum, an hourly reading, and a nearby storm report can all be useful without describing the same place or moment.
01 / GET YOUR BEARINGS
Check the weather date, not the date the PDF was made
The opening page identifies the selected location and local weather date. The report-generation date tells you when the document was created. Those dates serve different purposes.
In the Boston sample, the weather date is January 25, 2026; the PDF was generated on September 9, 2026. The hourly rows describe January 25. The generation date does not move the weather into September.
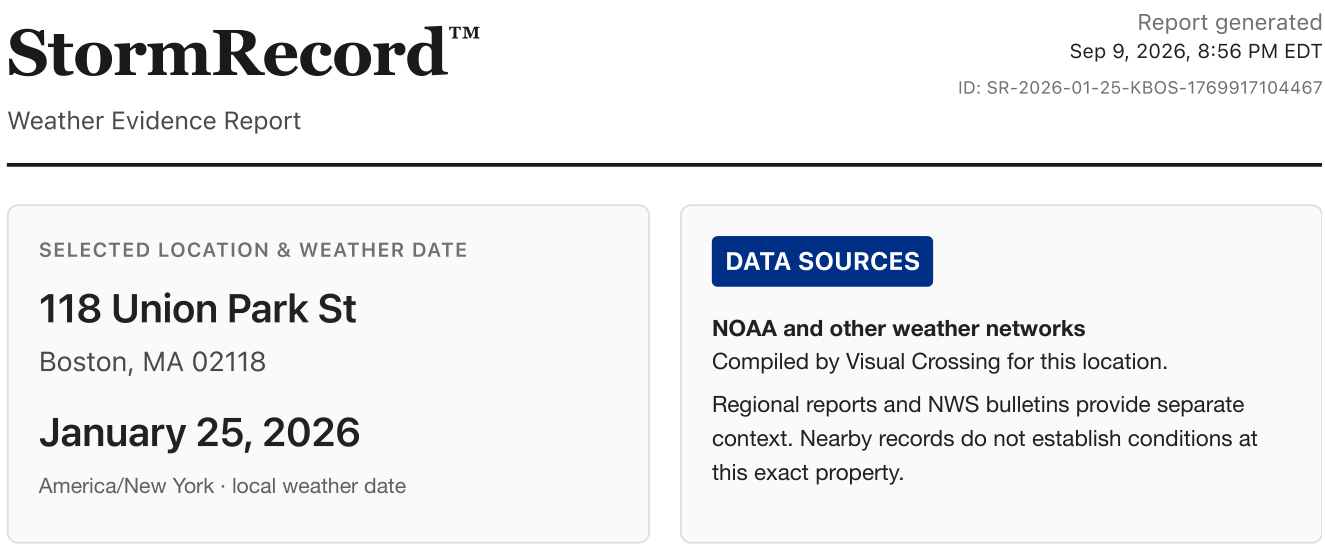
- Weather dateJanuary 25 is the day being investigated.
- Generation dateSeptember 9 is when this saved PDF was made.
Look for the local time-zone label too. The Boston and Bloomington examples below use EST. Preserve that label when comparing a report with a photograph, incident note, or another archive.
A station name provides geographic context. StormRecord's hourly data is a Visual Crossing location-based compilation, which can combine sources; the named nearby station is not established as the source of every value. The methodology page explains how the compilation works.
02 / READ THE HEADLINE NUMBERS
The daily summary tells you what to investigate next
Use the first page to identify the day's main values, then open the hourly table to find their timing. In Boston, the sample shows 0.71 inches of liquid-equivalent precipitation, a 47.9 mph peak gust, and a temperature range of 6.0–27.6°F.
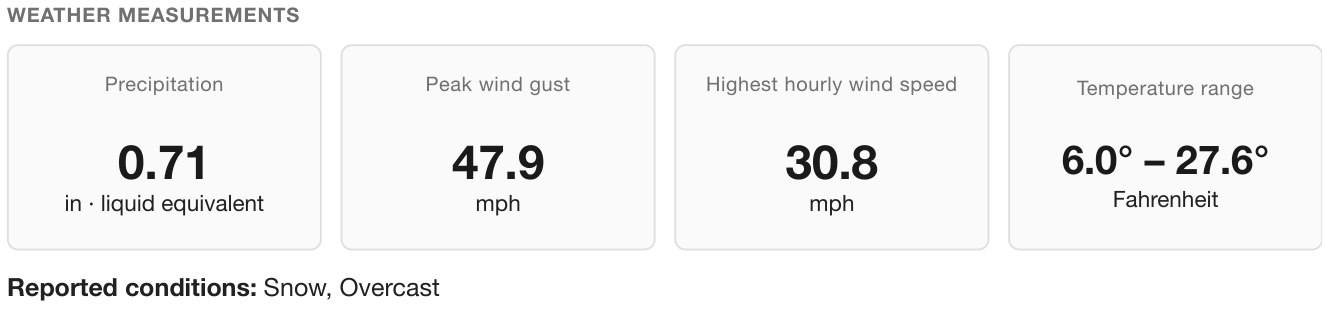
- Read the unitsThe precipitation label says liquid equivalent.
- Keep the wind fields separate47.9 mph is the gust; 30.8 mph is the highest hourly wind speed.
| Field | How to read it |
|---|---|
| Precipitation | The water amount for the stated interval. Liquid equivalent is not snow depth. Boston's 0.71 inches does not mean 0.71 inches of snow fell. |
| Peak wind gust | The largest available gust used in this report's weather summary. It does not establish the largest wind anywhere in the surrounding storm. |
| Highest hourly wind speed | The maximum of the returned hourly wind-speed values. It is a different field from gust and should not be substituted for it. |
| Temperature range | The low and high for the selected date. Use the hourly table when the temperature at a particular time matters. |
The detailed conditions page may also include snowfall, snow depth, visibility, humidity, pressure, and feels-like temperature. Read each field separately. A feels-like value is not the air temperature; a daily visibility value does not describe visibility at every hour.
If your version includes a severity category, read the rules behind that category. It is a summary under the report's methodology, not a finding about property damage or insurance coverage. The numeric record remains the useful starting point.
03 / BOSTON · JANUARY 25, 2026
Follow the day through the hourly table and chart
Boston's hourly record shows snow in the conditions field from 11 AM onward and stronger gusts later in the evening. Read across a row to keep the temperature, precipitation, and wind values attached to the same hourly timestamp.
| Local time | Temp. | Precip. | Wind | Gust |
|---|---|---|---|---|
| 11 AM | 8.0°F | 0.02 in | 7.7 mph | 11.4 mph |
| 4 PM | 21.9°F | 0.11 in | 10.9 mph | 25.1 mph |
| 8 PM | 26.5°F | 0.04 in | 26.4 mph | 33.8 mph |
| 11 PM | 27.6°F | 0.03 in | 30.8 mph | 47.9 mph |
What this tells you: the largest gust in the returned hourly record occurs at the 11 PM timestamp, after the afternoon precipitation highlight. The windiest hour and the wettest hour need not be the same.
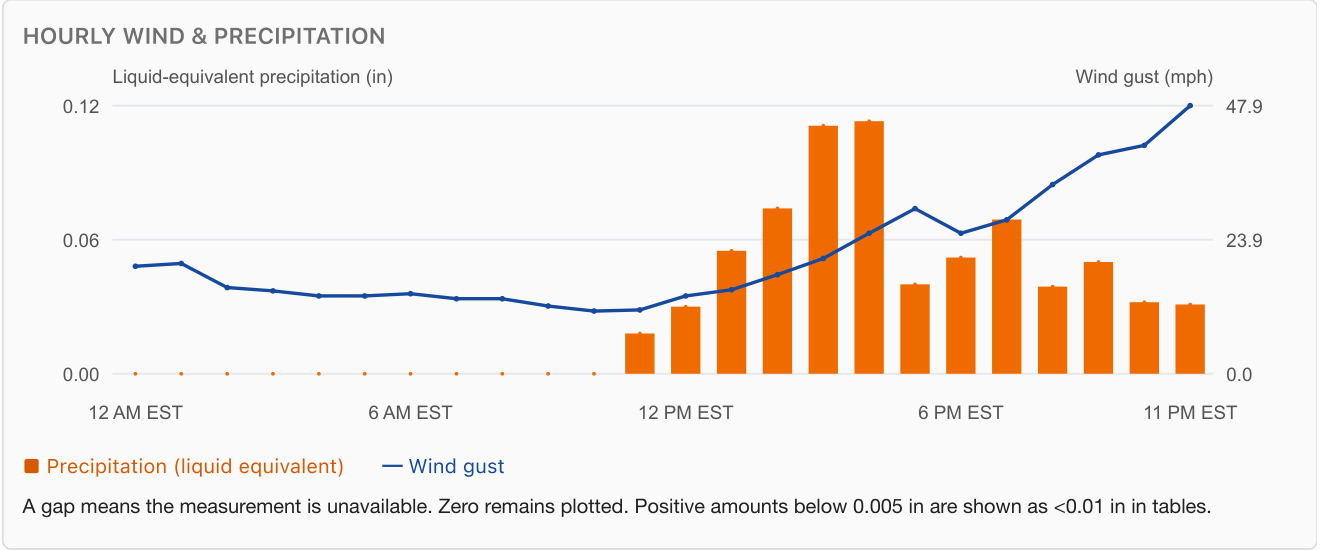
- Orange bars → left scaleLiquid-equivalent precipitation, in inches.
- Blue line → right scaleWind gust, in miles per hour.
Read the chart's orange precipitation bars against the left-hand scale in inches and the blue gust line against the right-hand scale in mph. Their heights use different units. A crossing between a bar and the line has no special meteorological meaning.
The sample highlights 4 PM for precipitation, while the rounded table prints 0.11 inches at both 3 PM and 4 PM. Use the displayed precision honestly; the rounded entries alone do not establish which amount was larger.
“At the 11 PM EST timestamp, this sample lists a 47.9 mph gust.” That keeps the value tied to its record without claiming it was measured at every Boston address.
04 / PUT WARNINGS ON THE RIGHT CLOCK
Issued, expires, and expected end are different timestamps
A warning bulletin records what the issuing weather office communicated about a hazard. Its forecast wording and expected period belong alongside the measurements, with their own time labels.

- Message expiryJanuary 25 at 4 PM is the printed bulletin-expiry field.
- Expected warning endThe warning period is stated to end January 26 at 8 PM.
| Printed field | Timestamp | Meaning here |
|---|---|---|
| Bulletin issued | Jan 25, 2:49 AM | When this message was issued. |
| Bulletin expires | Jan 25, 4 PM | The message-expiry field retained in the PDF. |
| Expected warning end | Jan 26, 8 PM | The planned end of the warning period stated in this bulletin. |
The bulletin's text gives a period beginning 7 AM on January 25. Its 4 PM message-expiry field does not say the snow stopped then. The next bulletin in the sample was issued at 12:41 PM on January 25 and retains the January 26, 8 PM expected end. These are historical message records, not a live-alert service or proof of the actual weather's ending time.
Do two bulletins mean two storms?
No. Boston's two winter-storm bulletins share the same NWS event identifier. Bloomington's three tornado-warning bulletins also share an event identifier. A count can include updates to the same warning. Check the identifiers and source text before counting distinct events.
Is a forecast snow total the same as a measurement?
No. Boston's warning discusses an expected 12–20 inches across its stated area and warning period. The PDF's 0.71 inches is liquid-equivalent precipitation for the selected date. Its regional records include separate snow reports, such as 15.20 inches at 11:26 PM EST. These differ in quantity, source, location, or time period; they are not interchangeable snowfall totals for the selected property.
The provider's separate snowfall and snow-depth fields also should not be forced to match a regional report. This guide does not reconcile every source discrepancy. If a snowfall amount is central to your question, check the original record's location and measurement period. Regional snow amounts may be running totals: do not add the rows together.
05 / BLOOMINGTON · FEBRUARY 19, 2026
A tornado warning and an hourly wind value answer different questions
Bloomington's summary lists a peak gust of 31.5 mph. Its warning section includes an emergency-management tornado confirmation, and its regional records include a separate wind report. Read the three sources together, with their timestamps intact.
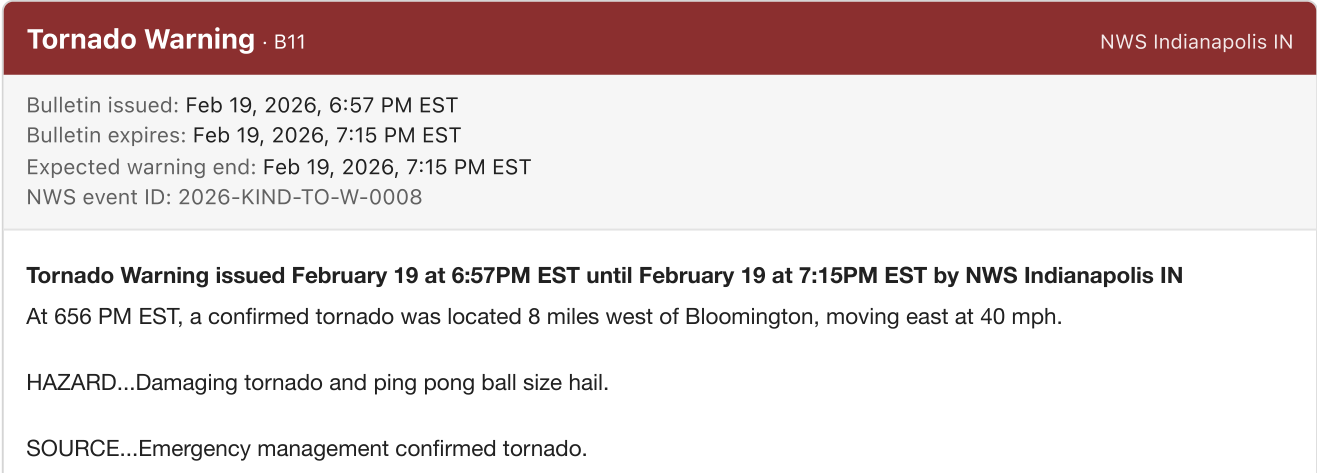
- Issue time: 6:57 PMWhen bulletin B11 was issued.
- Event time: 6:56 PMThe time described in the bulletin narrative.
| Time | Record | What it says |
|---|---|---|
| 1:21 PM | Tornado Watch B02 | Watch bulletin issued; county coverage appears in the source text. |
| 6 PM | Hourly table | 65.0°F, 14.9 mph wind speed, and 24.2 mph gust. |
| 6:39 PM | Warning B09 | Radar-indicated rotation; expected warning end 7:15 PM. |
| 6:51 PM | Warning B10 | Further radar-indicated warning bulletin. |
| 6:57 PM | Warning B11 issued | Describes a confirmed tornado at 6:56 PM, 8 miles west of Bloomington. |
| 7:01 PM | Regional record R05 | Lists 70.0 kts at Bloomington Monroe County Airport; source labeled ASOS. |
| 11 PM | Hourly table | 31.5 mph gust, the largest gust in this sample's hourly compilation. |
Notice the one-minute difference: 6:57 PM is the confirmation bulletin's issue time; 6:56 PM is the event time described inside that bulletin. Neither should be silently replaced with the other.

- 70.0 ktsKeep the original knots unit with this regional value.
- ASOS / named airportThe source and location belong to this particular storm report.
The 7:01 PM regional value is printed in knots, while the hourly gust column uses mph. It also comes from a separate, specifically identified record. Preserve its units and source rather than copying 70.0 into the hourly mph column.
Different locations, time intervals, and compilation methods can produce different records. This PDF alone does not establish the exact cause of the difference between its hourly and regional wind values. Neither value should be treated as the tornado's wind speed at the searched property.
For other regional entries, use the same reading order: event type → reported location → time → magnitude and units → reporting source → narrative. A county-level match is useful context, but does not mean every address in the county experienced that event.
06 / TAMPA · OCTOBER 9, 2024
Separate one day's totals from the whole hurricane
This example uses a newly generated report for 315 E Kennedy Blvd, Tampa, FL 33602, the public Tampa City Hall address. The weather date is October 9, 2024, in EDT. The PDF was generated on September 11, 2026. The address locates the search; these are not measurements taken inside City Hall.
The summary lists 11.99 inches of liquid-equivalent precipitation, an 86.6 mph peak gust, and temperatures from 71.7°F to 76.6°F. Its highest hourly wind speed is 63.2 mph, a separate field from gust. The precipitation total belongs to this one local calendar date, not every day affected by Hurricane Milton.
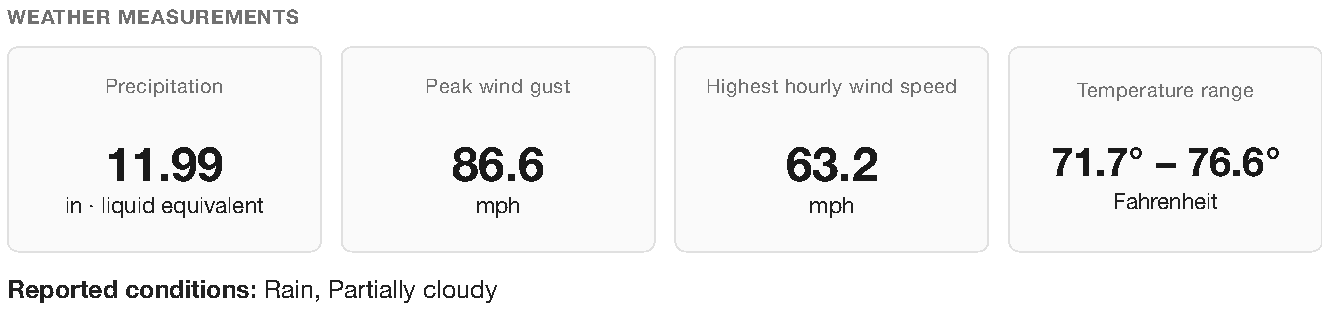
- One local date11.99 inches is the precipitation for October 9, not the entire hurricane.
- A peak is not a total86.6 mph is the largest gust in the returned weather record.
Find when the largest values occurred
The report supplies 24 hourly timestamps. These selected rows show increasing wind and precipitation later in the day, with different hours highlighted for the largest rainfall amount and gust.
| Local time | Temp. | Precip. | Wind | Gust |
|---|---|---|---|---|
| Noon | 75.3°F | 0.15 in | 16.3 mph | 32.7 mph |
| 6 PM | 73.5°F | 1.18 in | 24.4 mph | 48.5 mph |
| 9 PM | 73.1°F | 2.52 in | 55.6 mph | 85.4 mph |
| 10 PM | 72.8°F | 2.09 in | 63.2 mph | 86.6 mph |
| 11 PM | 71.7°F | 0.54 in | 55.5 mph | 82.2 mph |
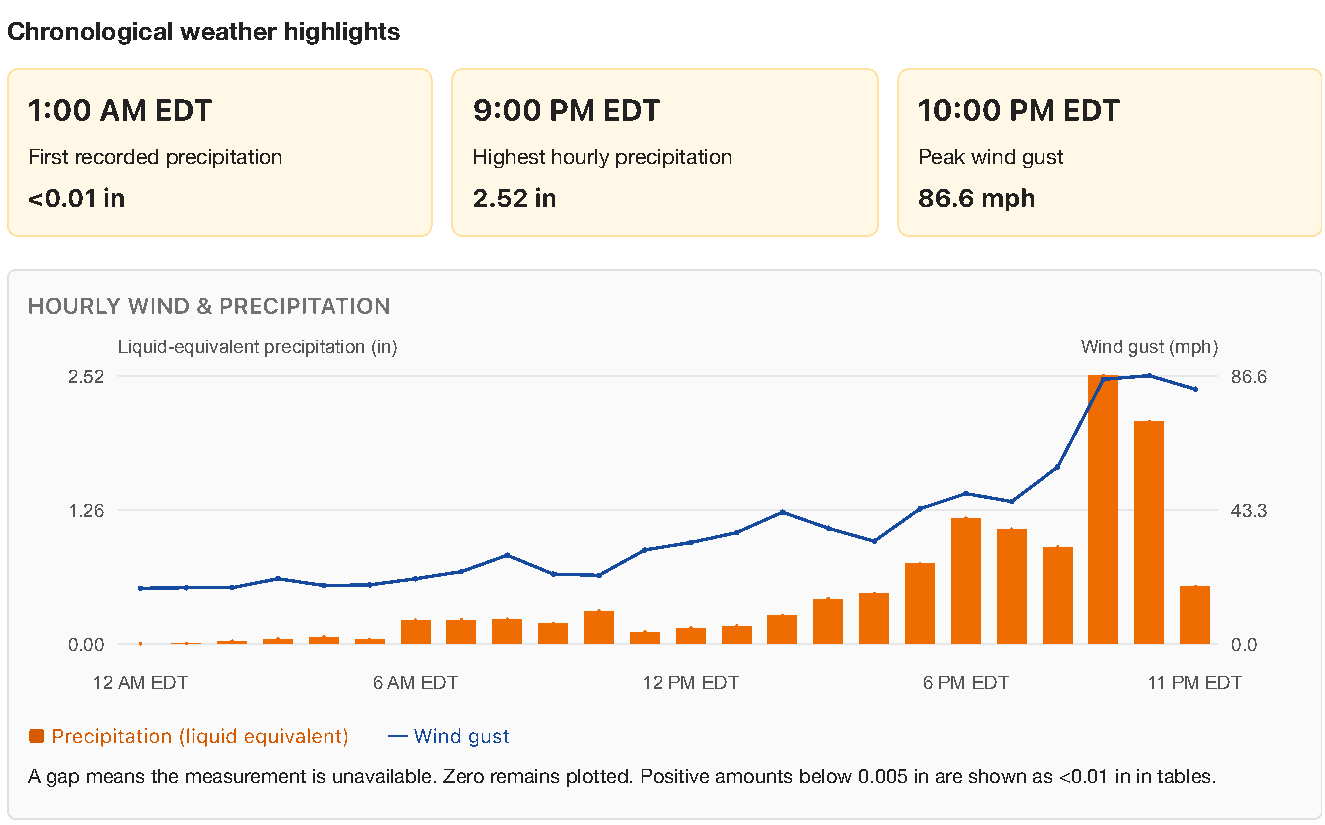
- 9 PM EDTThe largest hourly precipitation value is 2.52 inches.
- 10 PM EDTThe peak gust is 86.6 mph, one hourly timestamp later.
The highest hourly precipitation is 2.52 inches at 9 PM EDT. The peak gust follows at the 10 PM EDT timestamp. The day's 11.99-inch total includes the available hours across October 9; the selected rows above are only an excerpt. Rounding also matters: the source daily value is 11.986 inches, displayed as 11.99 in the PDF.
“For the selected Tampa address and October 9, this compilation lists 11.99 inches of precipitation and an 86.6 mph peak gust at the 10 PM EDT timestamp.” Neither number describes the whole hurricane or conditions at every property.
Read the warnings as messages about their stated area and period
Pages 4 and 5 list 29 bulletins: 7 Hurricane Warning, 7 Storm Surge Warning, 6 Flash Flood Warning, 1 Extreme Wind Warning, 3 Flood Watch, and 5 Tornado Watch records. These include updates, not 29 separate storms. Some messages were issued on October 8 and remained relevant to the searched date; the full bulletins retain their calendar dates.
For example, Extreme Wind Warning B23, page 30, was issued at 6:36 PM EDT on October 9. Its hazard-onset field also says 6:36 PM, and its expected warning end is 9:30 PM. Its narrative describes radar-indicated extreme winds associated with Milton's eyewall at 6:35 PM in the stated warning area. The message time, narrated time, and planned end remain distinct. A separate effective timestamp and message-expiry timestamp were not supplied for this record.
The source notes on page 39 identify partial warning-archive coverage because some requests or retrieval limits prevented a complete lookup. The retained bulletins are useful evidence of what was returned; the list is not a claim that every warning has been captured.
Keep regional event periods separate from the daily measurements
Page 38 lists four NOAA NCEI regional records for Hillsborough: three Hurricane (Typhoon) entries and one Storm Surge/Tide entry. R01 spans October 9 at 11 AM through October 10 at 8 AM EDT; R02 starts at 2 PM on October 9 and ends at the same next-morning time. Both are labeled Official NWS Observations. R03 and R04 are labeled Broadcast Media, with October 9 timestamps of 5:15 PM and 5:47 PM EDT.
Those regional periods can extend beyond this report's one-day weather table. Their reported-value fields say Not supplied; they do not provide a property-specific wind or water-depth measurement. The rainfall total does not establish coastal storm surge or water depth inside a building.
07 / KEEP THE CONTEXT WITH THE NUMBERS
Sources, missing fields, and report identity finish the picture
The sources page explains the compilation, nearby station context, time zone, retrieval time, and report-generation time. Keep those details when saving or sharing an excerpt so another reader can understand where it came from.
| Label | How to interpret it |
|---|---|
| 0.00 | A numeric value displayed to the report's precision. Read any trace-amount or rounding note supplied with that field. |
| <0.01 in | A small positive amount displayed below the stated threshold. The current samples use this for positive amounts below 0.005 inches. |
| Unavailable / not supplied | No usable value was supplied for that field. It is not a zero measurement. |
| Not queried | That dedicated data feed was not requested. Bloomington can still show regional hail reports even though the separate hail-size field says “Not queried.” |
| No matching regional records | The search returned no matches within its source and coverage limits. It does not by itself establish that no storm occurred. |
Boston and Bloomington each supply 24 distinct hourly timestamps in these samples. Check individual fields as well as row counts: a row can exist while a measurement is missing. Local dates around daylight-saving changes can also contain 23 or 25 hours.
A report ID identifies the document or saved record; it is not government certification. Record IDs within the regional section identify individual entries. Keep the PDF's source notes and date with any values you quote, and remember that later archive updates can change a newly generated report.
For an insurance or incident file, the report organizes weather information. Photographs, inspections, and other property-specific evidence answer different questions. Use the insurance weather-report checklist to assemble the supporting file. Ask the recipient which records they need; the PDF does not determine damage, coverage, or acceptance.
NOW TRY YOUR DATE
What would the records show for your location?
Choose a U.S. address and date, then read the available weather in the free preview. If you need a document to keep or share, the complete PDF costs $9.99 for one address and one local date.
Preview my weather reportNo account or subscription. Search yesterday through the past three years. Source coverage varies.
Sample reports and further reading
Boston and Bloomington explain saved September 9 samples. Tampa uses a fresh retrieval and PDF generated on September 11, 2026. These examples explain the records, not an independent reconstruction of each storm.
- Boston sample PDF: January 25, 2026; generated September 9, 2026. Pages 1–7 support the summary, hourly data, warnings, regional snow reports, and source explanations.
- Bloomington sample PDF: February 19, 2026; generated September 9, 2026. Pages 3–5 and 8–11 support the worked timeline and source distinctions.
- Tampa sample PDF: October 9, 2024; generated September 11, 2026, for 315 E Kennedy Blvd. Pages 1 to 3 support the measurements; pages 4, 5, 30, 38, and 39 support the warning, regional-record, and coverage explanations.
- StormRecord data sources and methodology
- Visual Crossing field definitions
- NWS: understanding severe weather alerts
Next: how to find past weather by address and date · what to include in weather documentation for a claim